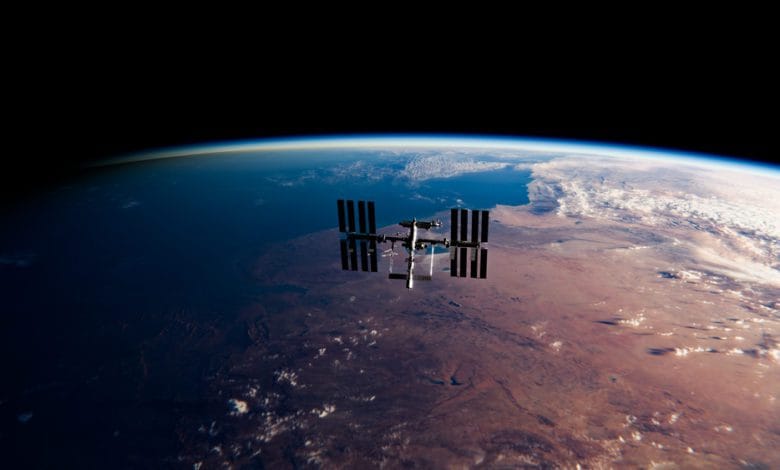
NASA shares pictures of the world during COVID-19 from Space
NASA was observing some positive effects of the negative disease

Karachi: While the earth plunged into a deadly disease that impacted all the countries across the world, NASA observed the impacts from the satellite on air, water, climate, and land.
Here are the before and after pictures of an air pollutant that decreased due to global lockdown.


The NASA COVID-19 Dashboard contains data obtained from Earth-observing satellites, International Space Station sensors, and important ground-based networks.
Several types of measurable transition, including economic measures such as shipping and building operation and environmental variables such as water quality and temperature variations, can be searched for in global maps. Investigate the data layers yourself or take a guided tour of how NASA Earth scientists study the impact of the pandemic on the Earth system and learn about it.
In order to analyze COVID-related impact on the Earth system, NASA scientists use several different methods that help comprehend the broader aspects of how the world is evolving because of shutdowns during the pandemic.
The Landsat satellite geological survey indicates declines in the influence of urban heat islands, a pattern in which urban areas are slightly colder during the pandemic than nearby rural areas.
Here are the before and after pictures

The left image shows temperatures over San Francisco in April 2018
Scientists discovered that large parking lots, highway lanes, and industrial rooftops were 10-15 degrees Fahrenheit on average, which shifted to 5-8 degrees Celsius.
In April 2020, the right picture shows temperatures over San Francisco where, relative to previous years, various spaces such as commercial rooftops, roads, and parking areas are cooler from March to May 2020.
The Landsat satellite geological survey indicates declines in the influence of urban heat islands, a pattern in which urban areas are slightly colder during the pandemic than nearby rural areas.


